Diagnostic Tables
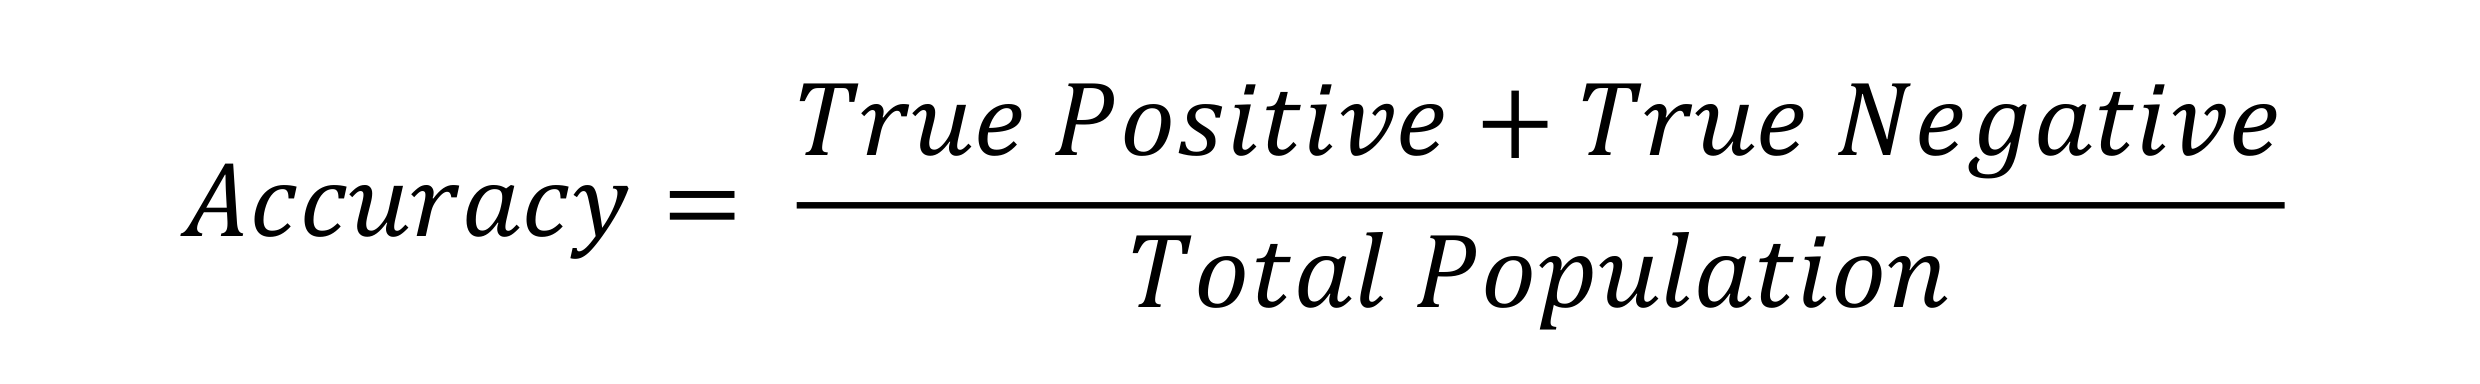
It is useful to have a method for evaluating performance of a diagnostic test. Unfortunately, the use of accuracy can be easily manipulated and at times misleading. For example, a test which predicts everyone as positive will have a high accuracy. When dealing with diagnostic tests, this would cause numerous problems with many patients given incorrect diagnoses. Thus, an alternative way to measure performance of diagnostic tests is needed.
The Diagnostic Table
A diagnostic table provides a simple way to display information pertaining to a diagnostic test. It allows users to see how test results correspond with the presence of actual disease.
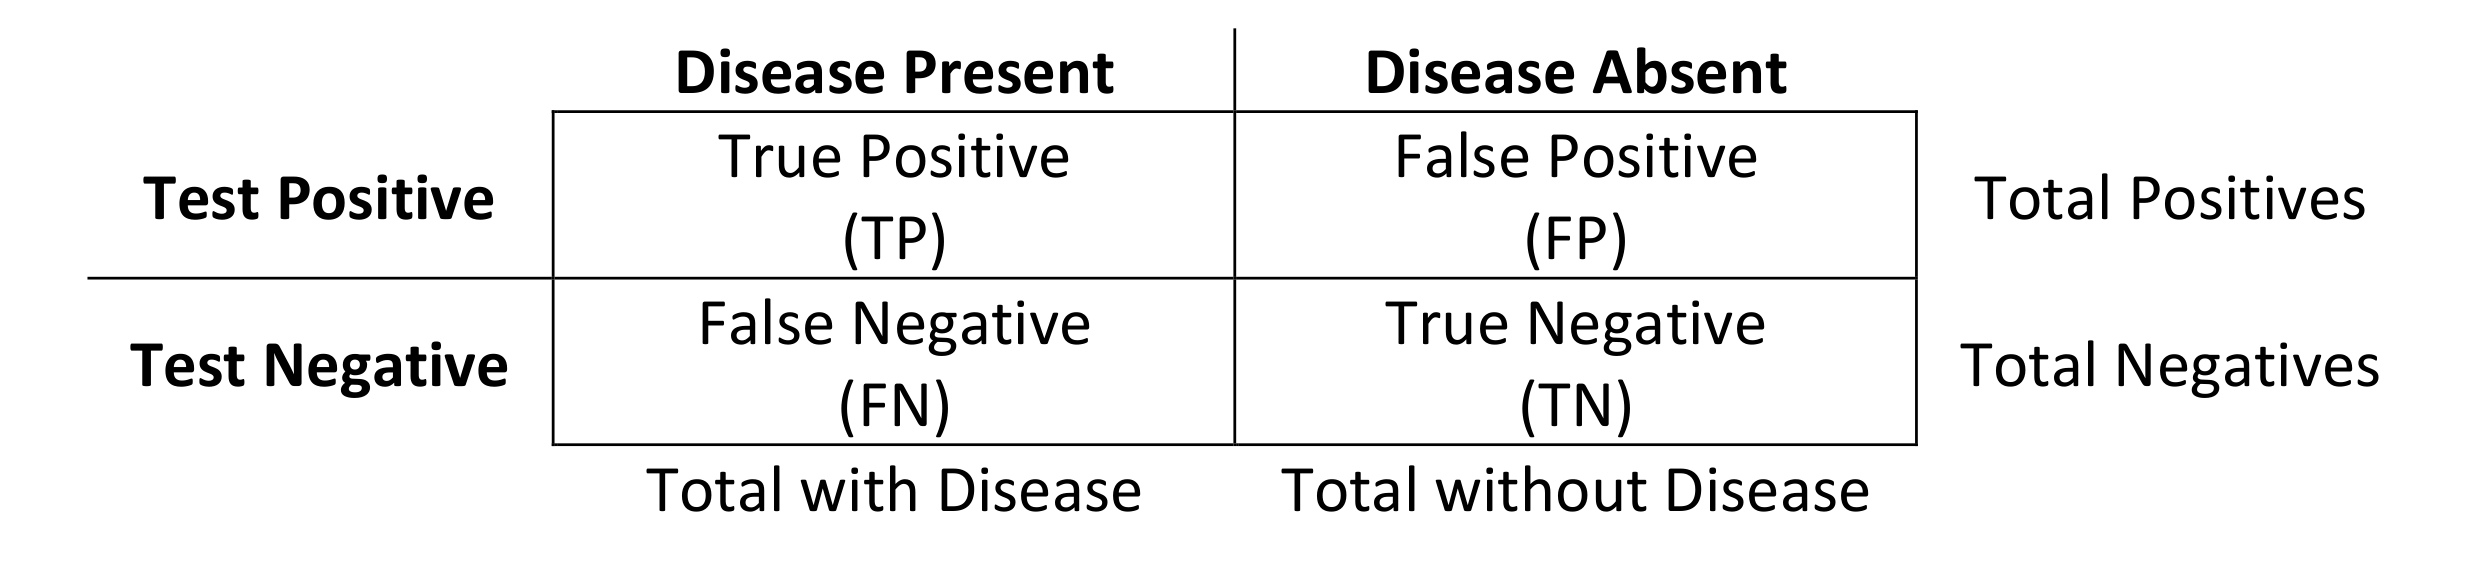
A false positive is also known as a type 1 error. A false negative is also known as a type 2 error.
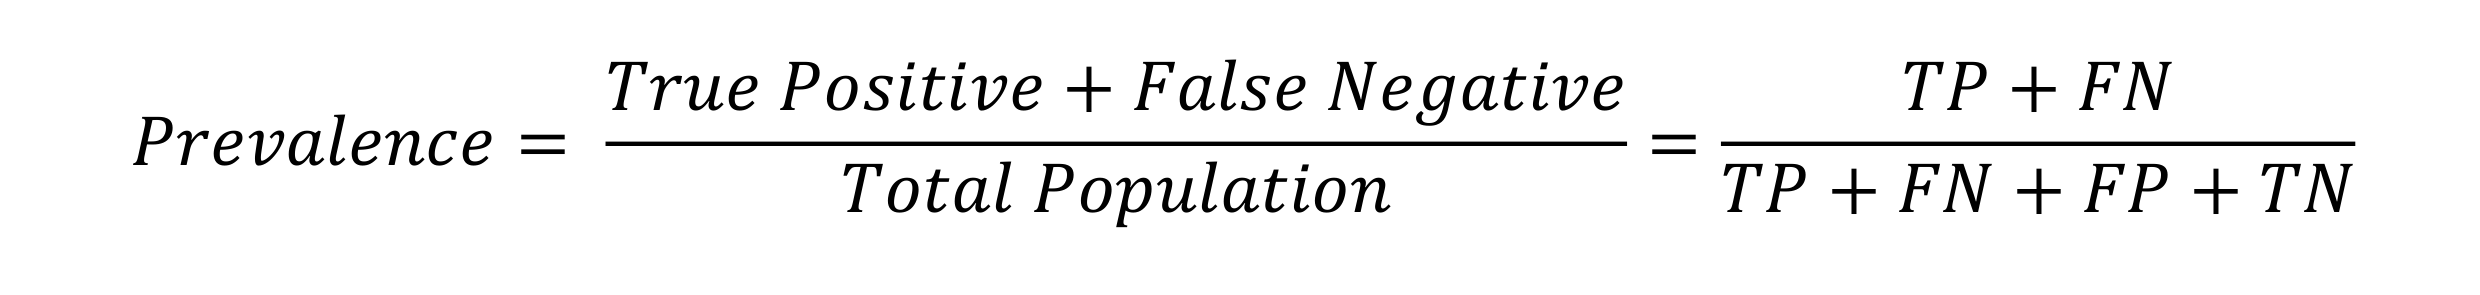
Prevalence
Prevalence is the proportion of individuals who have a disease.
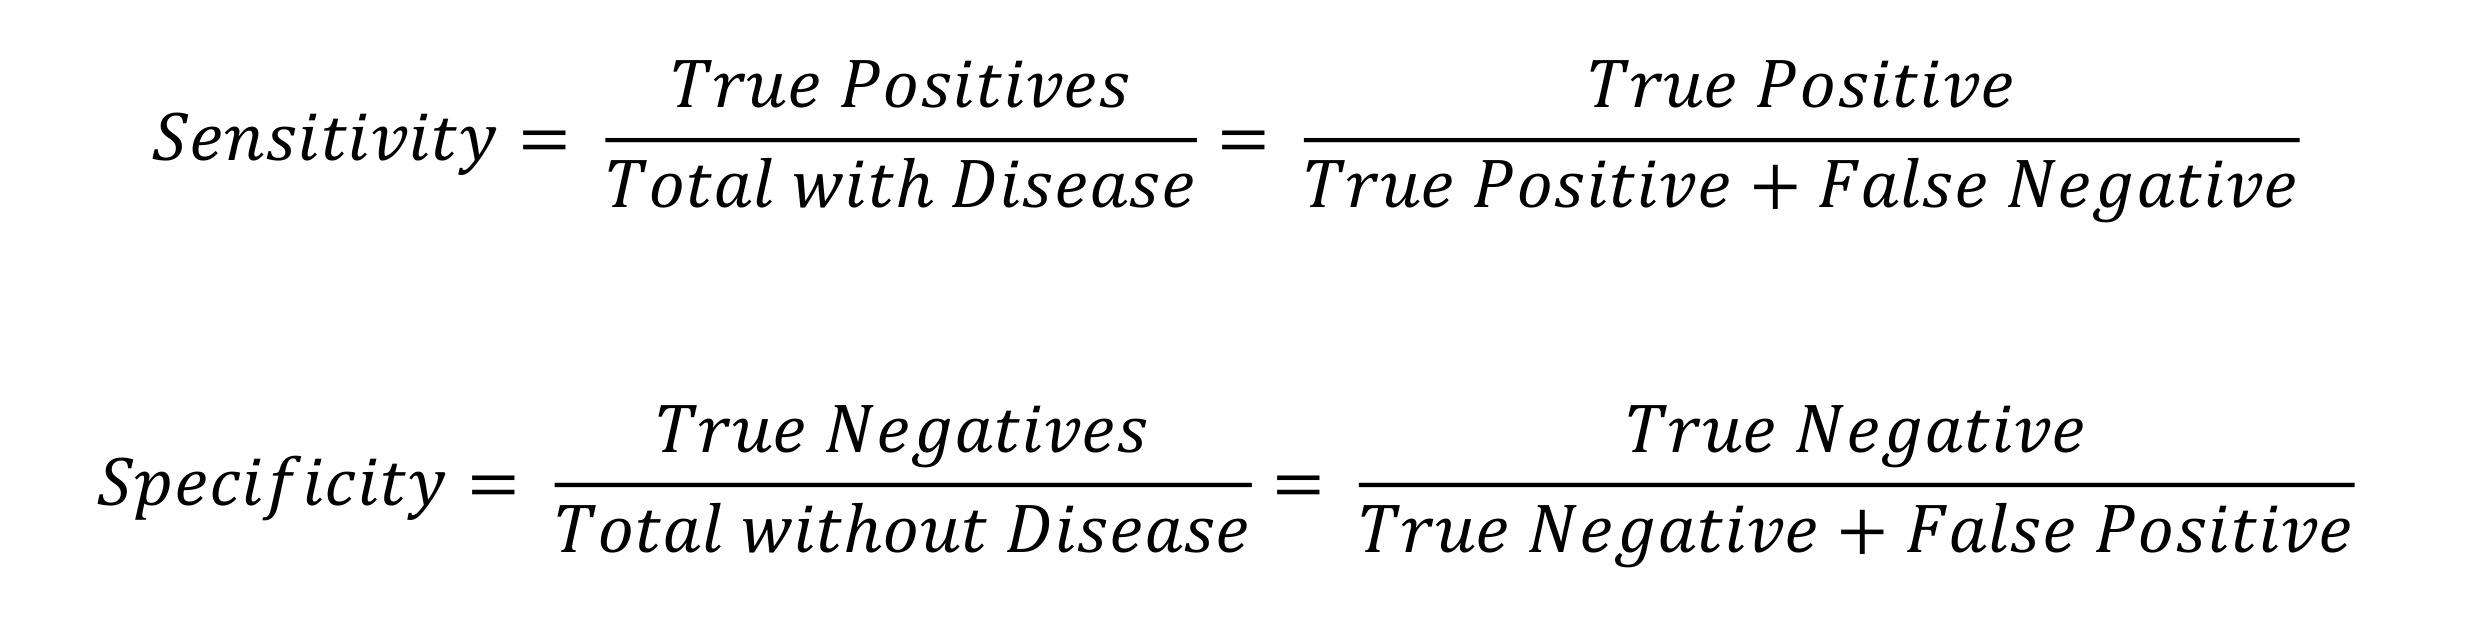
Sensitivity and Specificity
Sensitivity is the true positive rate. It is the probability of a positive test result when the patient has the disease. This is the ability of a test to pick up the disease it is testing for.
Specificity is the true negative rate. It is the probability of a negative test result when the patient doesn’t have the disease. This is the ability of a test to reject what it is not testing for.
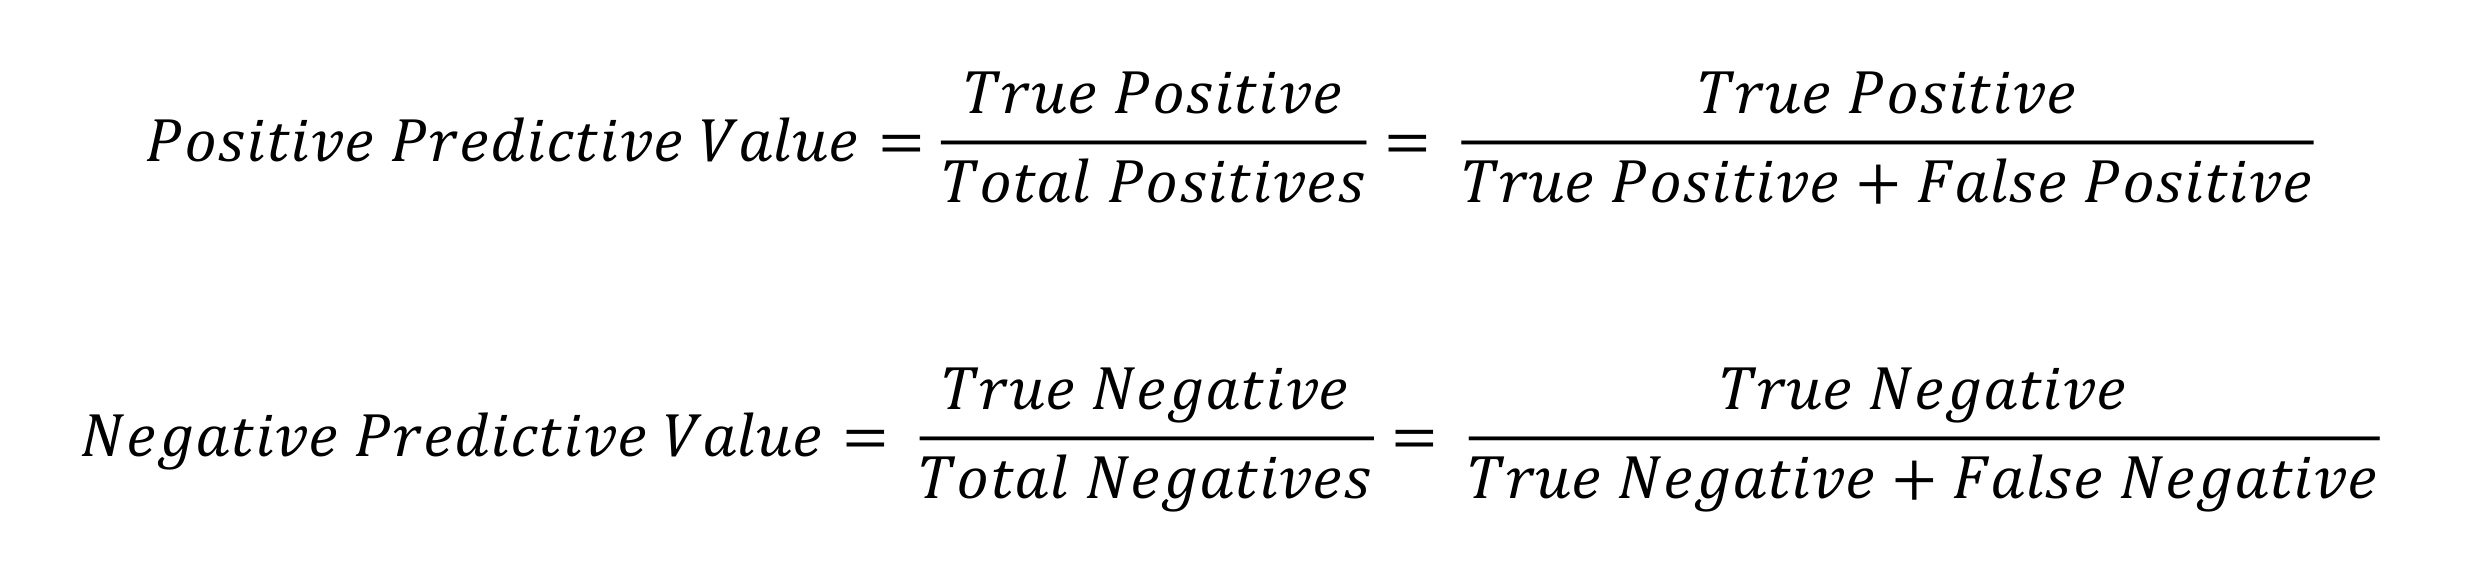
Predictive Values
Positive predictive value is the probability of the patient having the disease given the diagnostic test is positive.
Negative predictive value is the probability of the patient not having the disease given the diagnostic test is negative.
Establishing A Cut Off Value
A good diagnostic test is able to discriminate between those with and without the disease. The cut off value is the point at which a result can be said to be positive if above the threshold and negative if below it. The selection of the cut off value can be evaluated by calculating the sensitivity, specificity and predictive values. However, selecting the right cut off value also depends upon the clinical scenario in question.
Cut Off Clinical Relevance
For conditions that are easily treated, a high sensitivity is preferred. This is because a high sensitivity test will identify most of the patients with the disease and is therefore effective at ruling out the disease in a negative test result. High sensitivity tests are reliable when their result is negative since they rarely misdiagnose those who have the disease.
For conditions that are serious and untreatable, a high specificity is preferred. This is because a high specificity test will correctly identify most of the patients without the disease. Thus a positive result strongly suggests the presence of disease since high specificity tests rarely give positive results in healthy patients.
Getting The Cut Off Wrong
If the cut off is too high, there will be a few false positives but many false negatives. This would cause the test to miss many individuals with the disease resulting in a low sensitivity.
If the cut off is too low, there will be a few false negatives but many false positives. This would cause the test to indicate many healthy individuals have the disease resulting in a low specificity.
Changes in Populations
The predictive value is the post-test probability of the disease. The problem with predictive values is that they vary depending upon the population prevalence of a disease (a pre-test probability). On the other hand, sensitivity and specificity are properties of the test themselves and are stable or unchanging as the population prevalence (pre-test probability) changes. Thus, where a population prevalence changes, the predictive values will change, and the sensitivity and specificity will remain the constant.