Generating Ideas For Change
By now you should have identified a process you want to improve, assembled a team and together created a SMART aim statement with a family of measures. The next step is to generate ideas for change that you will test as you attempt to achieve your aim. This section provides advice on how to come up with those ideas and ways to represent your system process graphically.
Ideas for Change
You might be full of ideas for change, or perhaps you aren’t sure where to start. This section demonstrates there are many ways for you to generate ideas, whether as a group or an individual. Consider the following:
- Read a book
- Reflect on the current system
- Study industries distant from healthcare for sources of inspiration
- Talk to peers, experts or others
- Generate a fresh perspective.
- Partner with your stakeholders by using these different methods.
- Critically appraise the current system
- Produce a process map or flow chart to get a systems-level view. Use this to visualise which steps add value and which steps waste time.
- Gather and analyse data on the way your system currently works. Use this to identify parts that are not working well or are excessively complex.
- Benchmark against others
- Compare your processes to best practice and discover the areas you need to develop ideas for improving performance.
- Use technology
- Consider automation, new equipment or new information systems.
- Beware the pitfall of making a bad system accessible rather than fixing the system.
- Creative thinking
- Identify the boundaries that limit change and dismantle them.
- Consider unrealistic goals that can prompt you to break out of your old way of thinking.
- Expose yourself to situations that spark new ideas.
- Use change concepts
NHS Improvement has produced resources on how to brainstorm effectively and also how to think creatively. You can then use affinity diagrams to help review and analyse the ideas you have generated.
Change Concepts
The Associates in Process Improvement have created a list of 71 change concepts that can be used to develop ideas for change. They act as a scaffold during the creative process by provoking new ways to think about the problem. This leads to the development of new ideas for improvement. A change concept is defined as “a general notion or approach to change that has been found to be useful in developing specific ideas for changes that lead to improvement”. Maximise your ability to generate ideas by using the change concepts in combination with subject expertise and knowledge. In other words, design the change with the help of frontline staff and patients. Involve your stakeholders!
Read more from the Institute for Healthcare Improvement on change concepts.
Eliminate Waste (1-11)
- Eliminate things that are not used
- Eliminate multiple entries
- Reduce or eliminate overkill
- Reduce controls on the system
- Recycle or reuse
- Use substitution
- Reduce classifications
- Remove intermediaries
- Match the amount to the need
- Use sampling
- Change targets or set points
Improve Workflow (12-23)
- Synchronize
- Schedule into multiple processes
- Minimize handoffs
- Move steps in the process close together
- Find and remove bottlenecks
- Use automation
- Smooth workflow
- Do tasks in parallel
- Consider people as in the same system
- Use multiple processing units
- Adjust to peak demand
- Change the order of process steps
Optimise Inventory (24-27)
- Match inventory to predicted demand
- Use pull systems
- Reduce choice of features
- Reduce multiple brands of the same item
Change the Work Environment (28-38)
- Give people access to information
- Use proper measurements
- Take care of basics
- Reduce demotivating aspects of the pay system
- Conduct training
- Implement cross training
- Invest more resources in improvement
- Focus on core process and purpose
- Share risks
- Emphasize natural and logical consequences
- Develop alliances and cooperative relationships
Enhance the Producer-Customer Relationship (39-46)
- Listen to customers
- Coach the customer to use a product/service
- Focus on the outcome to a customer
- Use a coordinator
- Reach agreement on expectations
- Outsource for “free”
- Optimize level of inspection
- Work with suppliers
Manage Time (47-51)
- Reduce setup or start-up time
- Set up timing to use discounts
- Optimize maintenance
- Extend specialist’s time
- Reduce wait time
Manage Variation (52-59)
- Standardization (create a formal process)
- Stop tampering
- Develop operation definitions
- Improve predictions
- Develop contingency plans
- Sort product into grades
- Desensitize
- Exploit variation
Design Systems to Prevent Errors (60-63)
- Use reminders
- Use differentiation
- Use constraints
- Use affordances
Focus on Design of Products and Services (64-71)
- Mass customize
- Offer product/service any time
- Offer product/service any place
- Emphasize intangibles
- Influence or take advantage of fashion trends
- Reduce the number of components
- Disguise defects or problems
- Differentiate product using quality dimensions
Utilising Diagrams
There are three diagrams you may choose to enhance your ability to generate ideas. They operate in different ways, but both result in focus and stimulate the generation of ideas. All three are introduced below. Additional methods are possible, including value stream mapping, spaghetti diagrams and other mapping methods.
Cause and Effect Diagrams (Fishbone)
A cause-and-effect analysis helps you to think through all the causes of a problem before you start to work on a solution. This is beneficial because it forces you to consider the root causes and obscure causes, both of which may play a large role in successful completion of your aim. It is a great tool for trying to understand why a problem occurs. An added benefit is it categorises the causes and provides a further framework for your improvement ideas.
Creating a fishbone diagram is easy. On the right-hand side of the page create a box and place the problem you wish to tackle within it. Draw a horizontal line across the page connecting to the box. Identify a few categories for major contributing factors and label each one along a diagonal line which connects to the horizontal. Work as a group with input from stakeholders involved in all the different parts of the process and place potential causative factors under each of these main categories. At this point you will have a diagram showing all of your possible causes for the problem. Now you should identify which causes are genuine and determine which ones have the biggest impact. This is where process mapping comes into play.
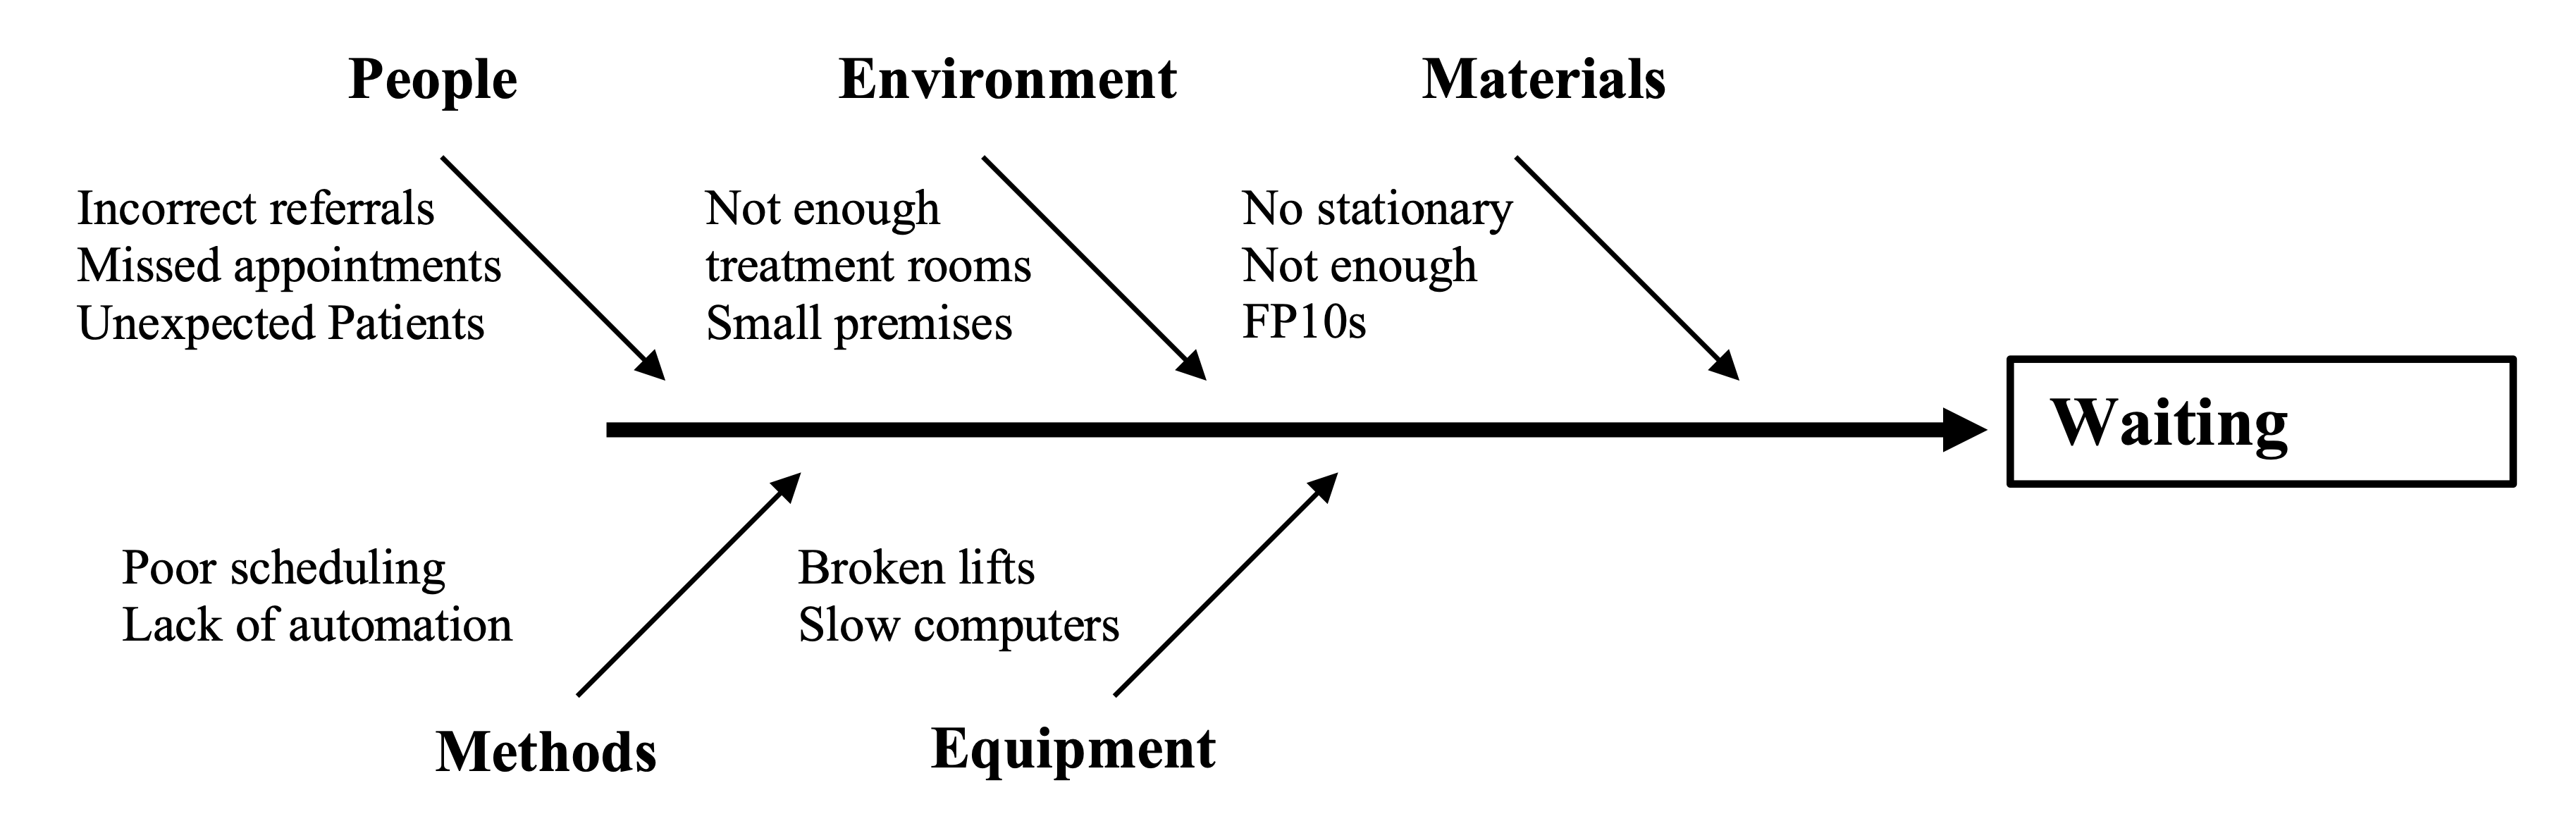
If you struggle to come up with any major categories, consider using the following headings:
- Materials (supply, design, availability, maintenance)
- Methods (steps in care process, steps in supply chain)
- Environment (staffing levels, workload, shift patterns, administrative support, policies, regulations)
- Equipment (equipment or tools needed to get the job done)
- People (staff knowledge, staff skills, staff competence, patient behaviour, supervision)
Read more from NHS Improvement on cause and effect diagrams.
Process Maps
A process map is a visual display of all the activities within a system. It can be used to help us understand how the current system is designed by capturing the reality of the underlying processes. A process map can be used to identify areas of duplication, waste, unhelpful variation and unnecessary steps. It will also highlight the bottlenecks, areas that improvement could be focused on. You should involve people from every step of the system to contribute and explore their perspectives. If done well, you will air lots of frustrations and challenges. Addressing these will generate ideas for improvement. Using the process map before implementing a change has the added benefit of highlighting any unintended consequences of your intervention before they occur.
Creating a process map is simple. Begin with a mixed group of stakeholders and go to where the system operates. Ask the stakeholders to think about an average patient and describe the process from a macro level, outlining each step along the way. Write onto your chart the starting point and the end point. Use different symbols to represent the different types of system component (pill for start and end, box for each step, diamond for decisions). During this process, the stakeholders will often describe multiple methods for completion of a task. Listen to the conversation and you will be able to generate ideas for improvement from the discussion. In most cases improvements will have to occur across several different departmental boundaries.
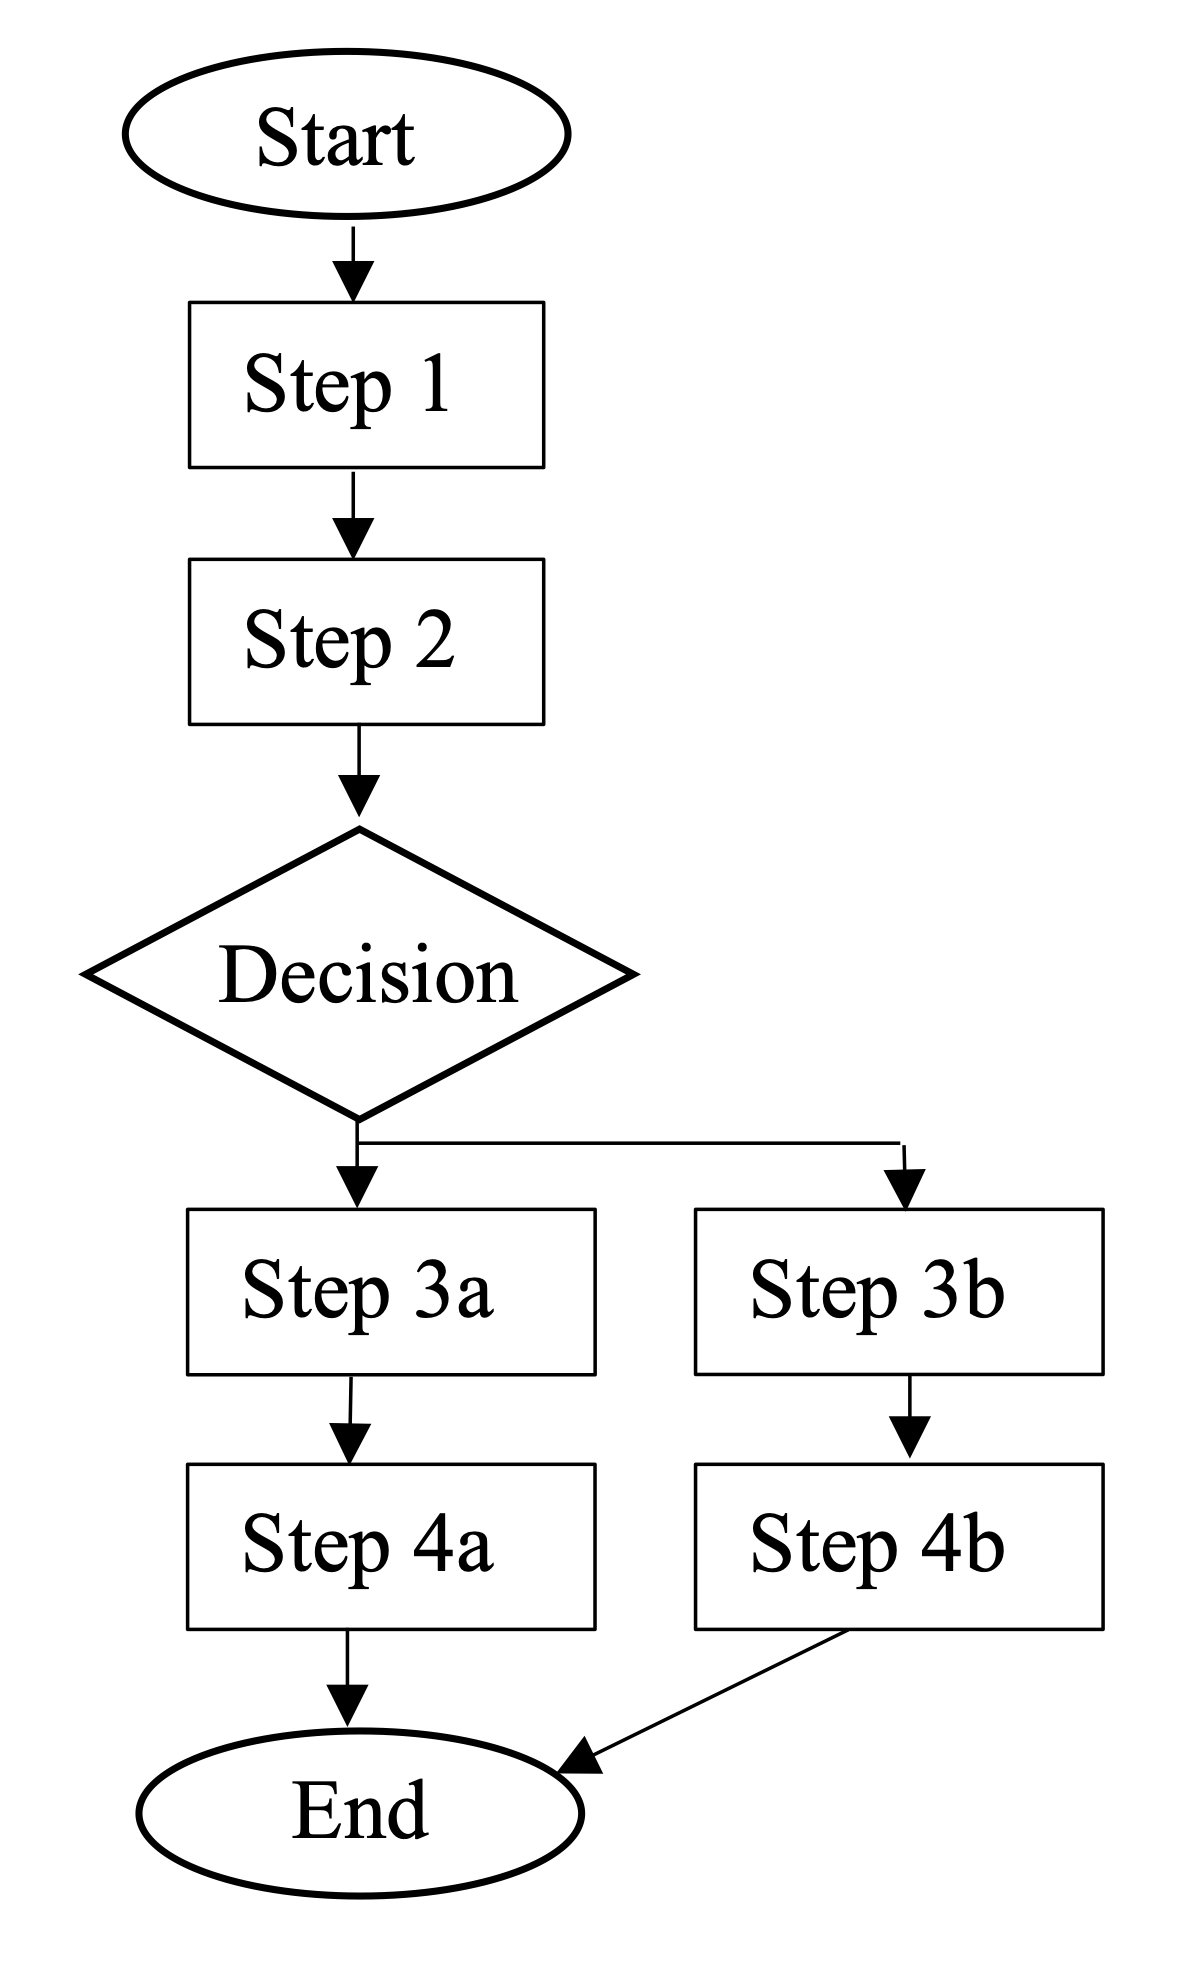
Read more from NHS Improvement on conventional process mapping. You can explore how to generate further ideas from your process map.
Driver Diagrams (Tree Diagrams)
A driver diagram is a simple tool that can be used to help show your theories of cause and effect within a system. It is a structured chart consisting of three or more levels that translate a high-level goal into a logical set of factors that contributed to the creation of this goal. Driver diagrams are particularly useful in identifying gaps between your current system and your ideal system. In fact, it can be used to generate ideas on how to fill those gaps.
A driver diagram is simple to construct. Begin with your aim (remember this should be clearly defined and measurable). Then brainstorm for potential drivers which influence the aim. Identify the links between these drivers, cluster them into common groups where possible and begin arranging them in a hierarchical manner. Your aim is driven by ‘primary drivers’ which are in turn influenced by a group of ‘secondary drivers’. The ‘secondary drivers’ may have influence across multiple ‘primary drivers’ and will have different strength relationships. This can be noted by drawing dotted lines for weaker relationships. Finally, you can decide on actions to adjust each driver in order reach your aim.
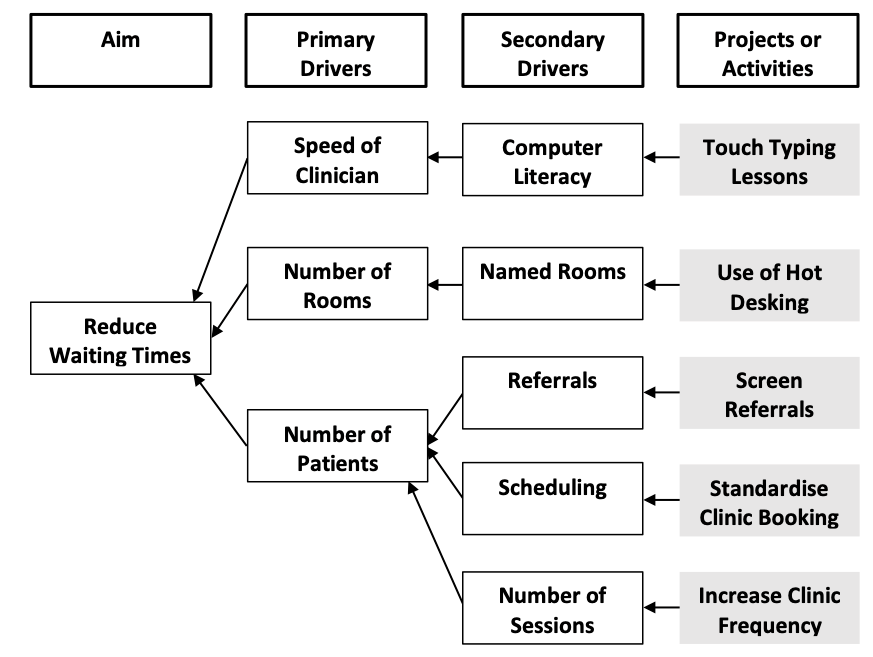
Read more from NHS Improvement on driver diagrams.
References
- Institute for Healthcare Improvement: Change concepts
- NHS England: The how to guide for measurement for improvement
- NHS Improvement: Fresh eyes
- NHS Improvement: Partnership working
- NHS Improvement: That's impossible
- NHS Improvement: Brainstorming
- NHS Improvement: Thinking creatively
- NHS Improvement: Mapping the process
- NHS Improvement: Cause and effect diagrams
- NHS Improvement: Theory of constraints
- NHS Improvement: Conventional process mapping
- NHS Improvement: Breaking simple rules
- NHS Improvement: Driver diagrams